 Skip to content
 A “SHED SCIENCE” REPORT ON THE DUAL PERSONALITY OF LENSES by Russ Sadler
INTRODUCTION
It was 3000 years ago that Greek philosophers toyed with the seeds of lens theory as they explored the basics of how light might work. Just 300 years later the Egyptians were exploiting those theories by polishing glass surfaces to emulate the refraction effects they witnessed in water.
Light is the same now as it was then and although today’s lenses are manufactured by CNC equipment and designed by sophisticated computer programs, the underlying ray tracing theories, just like light, have remained unchanged.
In the 1960s, man interfered with the natural order of the universe and created a new type of light that Galileo and the ancients could never have imagined. LASER light. Perhaps I exaggerate a little because this was just the same old light repackaged in a different box but with IMPROVED on the
label.
It obeyed all the ancient and modern laws of lens theory but it had one particular property that made it different. Scientists had discovered a physics phenomenon that allowed them to create monochromatic light where the wavelength of photons could be fully phase synchronized. (Just like a
marching army.)
With more research, that initial discovery became the “death ray” of science fiction. Random raindrops are not dangerous until a quirk of nature organises them to act in synchronism and they become a tsunami. That is in effect what a LASER is, a light tsunami because it synchronizes the individual photon energies into one powerful stream of light energy. As I said, it’s normal light (raindrops) repackaged.
Applications for this type of light have proliferated in the past 60 years and for 30 years or more this special light ENERGY source has been developed to fit into industrial metal cutting machines with several thousand watts of cutting power. More recently, compact lower power laser sources have been developed and those are what we use in our small industrial and hobby laser machines for non-metal cutting and engraving applications.
That jumps us through several thousand years of history in a single page and gets us to the starting point for this report. Many technologies exist for creating different wavelength laser sources but this study uses a CO2 laser wavelength of 10.6 microns. It will look at two different methods of creating a
CO2 laser beam because each beam has its own unique properties that react differently when passed through a laser lens.
Download the Case Study in PDF Format Here
BACKGROUND FOR THIS STUDY
I am retired after a long and varied career in engineering. At one stage I owned two 3kw metal cutting CO2 laser machines as part of a precision sheet metal business. It was with this background that, upon retirement, I bought a cheap Chinese sealed tube laser machine sporting 50 watts of destructive power.
I thought it would be a simple transition from metal to destroying pieces of wood and plastic. I was wrong!!!!!. Seven years ago, there was almost zero help on www or YouTube to aid my learning, thus I had to embark on my own solitary learning journey utilizing the skills that a lifetime in engineering had gifted me.
The first 3 years were just about understanding the very basics of the machine and laser technology. There were many things that I took for granted because although this was a cheap poorly assembled machine, all the elements were well proven pieces of engineering technology ie the linear bearings, the stepper motors, the laser tube the lens etc etc.
The physics of how a laser tube lives, works and dies consumed much of my first year but eventually I managed to drag enough pieces of the jigsaw puzzle from many unreadable scientific papers to create a simple functional model of how a laser tube works. After 3 years I was beginning to become (so I thought) moderately competent. I had bought several different lenses because all the reading I had done indicated I needed a variety of
lenses for different applications.
My knowledge of optics and lens theory did not extend beyond what I learnt when I was at school and college in the dark ages. If I categorize it as “ankle deep” that may still be an exaggeration. However, it was as a young design engineer that I acquired great observation skills along with huge amounts of mistrust and scepticism. This came about from my mentors who continually insisted that “Fully understanding a problem was 50% of the solution”. This trained me to observe, analyse and then reverse engineer to the source of the problem.
Those are the skills I had to employ for this study because as the title implies, I have no sophisticated laboratory equipment to aid my quest and because the laser beam is invisible, my ignorance of optics is a bonus, as I have no preconceived rules that I have to recognize. Just like a plane crash investigator, I only have damage to examine and I have to try and assess what direction and intensity level the light was to cause such damage. More of that later.
To this point I had trusted the well proven lens technology, after all, as I mentioned in the introduction, two and a half thousand years can’t be wrong. I had read all about energy density at the focal point being responsible for various degrees of material damage i.e. the greater the watts/sq mm the more damage results.
On that basis, for a fixed power level, a 38.1mm focal length lens with its smaller theoretical spot size at the focal point will have a much higher energy density than a 50.8mm focal length lens, which, with twice the spot area, will have half the energy density.
Hmmmm. Big problem. The 2” lens cut the same test material at almost twice the speed. Based on theory, this was illogical and was the first clue that maybe this weird laser light was outside the boundary conditions that exist for NORMAL light lens theory. But how or why?
- Once I had this doubt, it became easy to demonstrate that EVERY performance specification claimed for lenses was invalid when a laser beam passed through. Focal distance was not the fixed entity specified on the box, it varied with material, speed, power and beam diameter.
- The theoretical spot size was meaningless, typically the closest I could get with a variety of lenses and materials was 3 to 4 times that claimed.
- Focal depth (working distance) became meaningless.
The biggest problem with these specifications is they rely on a fixed beam diameter. As we will see shortly. That is possible with normal light but not with a laser beam.

The illustration above is a ramp test that is one of the popular methods of finding the focal distance of a lens. It is a simple demonstration that lenses are not acting according to their specified properties.
Note several points.
- The optical focal point is at 38.1mm and none of the focal points (thinnest line widths) coincide with the optical focal point.
- The optical spot size should ideally be 0.075mm for this lens focal distance. As can be seen, the thinnest line is X2 or X3 this value. AND that is not even the spot size. A static beam will produce a spot size around X10.
- Note the differing focal distances that happen when speed and power change. Differing combination will create bigger differences.
- Note how different materials (acrylic and wood) using the same parameters are NOT showing the same focal distances or the same line widths.
It is fair to say that there is absolutely nothing wrong with lens design when applied as transmitters of NORMAL light IMAGES. The generally accepted belief that lens theory is 100% applicable to laser beams must be incorrect and seems to be an ignored subject.
This was the beginning of a 3-year quest with many strange experiments, using different sorts of lenses to see if my reverse engineering techniques could reveal the true nature of this DARK and unexplored characteristic of lenses.
Phase 1
What is the mechanism that allows lenses to create deep parallel cuts?
I had conducted a massive study using nearly all available lens types, focal lengths. I used 3 different 10mm thick materials, poplar plywood, MDF and acrylic to conduct full power (70 watts) cutting tests.

This image represents the way that LASER lenses are described, even by the big optics companies. As I have already demonstrated, NONE of this information applies when you pass a CO2 laser beam through them. Let’s ignore the details and look at the concept.
The idea of a lens is to project an IMAGE. To preserve the integrity of the incoming image what happens after the focal point must be symmetrical to what happens before the focal point or the image will be scrambled.
My cutting tests, and what many laser users know but never question, is that the slot (kerf) they cut is usually deep and parallel. That is totally illogical when you look at the ray diagrams above. How can a diverging beam of decreasing intensity do any damage beyond a focal point? However illogical this seems, it does and I can assure you that light does travel in straight lines and there is nothing wrong with these diagrams, it’s just our easily confused imagination that is the problem.

Study the straight parallel cut being produced here and you will understand my desire to decode just how a lens can perform this task in contrast to what our imagination tells us.
I had hoped that my massive lens and cutting study would reveal patterns of cutting that would point me to that illogical mechanism. Although I used the data to disprove many popular laser cutting myths, the contribution it made to my quest was zero.
All my experimental work and research is recorded in my RDWorks Learning Lab videos on Youtube.
<Editor: All of these videos can also be found on LaserUser.com through the Video Tutorial Series Menu Item. Just click on Menu for the RDWorks Learning Series.>
Disclosure
I must declare that my mechanical and production engineering training plus a wide variety of career skills EXCLUDE science or optical engineering qualifications. Thus, many will consider me ill-suited to investigate this subject. However, as you will discover. I need but a few simple and non-controversial pieces of optical knowledge for this task.
My “best friend” in these tests is acrylic, a material that is transparent and an excellent absorber of 10.6micron wavelength energy. It does not melt to leave a gooey mess but instead, liquifies at about 160 C and then boils and evaporates at temperatures above 200C to leave clear ”footprints” of the damage light energy has caused.
As a crash investigator, I record the damage and then speculate as to the probable cause. In this report I present the evidence and my personal interpretation based on just a few simple optical facts:-
- As all ray diagrams portray, light travels in straight lines
- Refraction through certain materials will “bend” the light to a new direction
- Photons of light possess energy which will be transferred to mechanical/heat energy upon collision with the SURFACE of a non-reflective solid material.
- I use the word “intensity” as a more easily understood description of brightness. I find the more scientific term “energy density” inadequate to describe what I am exploring because it has already failed me once
- I give credit to Prof. Elias N. Glystis for his presentation of Lens Aberration Fundamentals Slide 1 (ntua.gr) Although this lecture has nothing to do with laser beams, I was able to see how the lens properties described in this document explained why laser beams can cut.
I have no problem if others interpret the data that follows differently.
APPROACHING THE ANSWER IN SMALL NECESSARY INCREMENTS
1. The Way Light Affects Material Damage
We all understand that sound waves make our ear drums move. This is an example of invisible sound energy being transferred to kinetic energy as it hits the eardrum The world around us is made up of molecules and atoms that are in constant motion and so they possess kinetic energy. At a higher temperature they have more kinetic energy. It is more understandable to say if you make a molecule vibrate faster it gets hotter.
There are many ways to add kinetic energy to a molecule. One way is with light waves that act just like sound waves but at about a trillion times the frequency. Light waves can therefore add kinetic energy to molecules and make them vibrate more violently i.e. the molecules get hotter.
It is a very important to understand there is no heat in a laser beam. Just like sound, it is invisible energy (in this case light energy) that is being converted to mechanical vibration as it hits a molecule. The resulting extra molecular motion is measured as an increase in temperature.
We see things burning and bursting into flames and are happy to imagine that is due to a hot laser beam. In reality it is the light energy stimulating molecules to vibrate so violently that it breaks the atomic bonds and shakes the molecule to pieces. The atoms that make up a molecule are not destroyed but are now free to combine with other atoms and create new molecules (substances/chemicals/materials) such as ash, flammable vapours gasses etc.
It is equally important to understand that light energy hits the SURFACE of a material and not until that surface has been vaporised (for example) is there a NEW surface exposed to absorb the light energy.
You will see regular reference to light INTENSITY. The higher the light intensity the faster a molecule can be injected with energy i.e. it will heat up quicker if the light is more INTENSE.
2. The Difference Between a Normal Light Beam and a Laser Beam.

If we could see the laser light then the left image is a cross section of the laser beam showing the light INTENSITY at the centre is high and fades away to nothing at the edge. The beam on the right is normal light where the intensity is uniform across the whole area.
A laser beam gets its intensity distribution properties from the way the laser tube is designed. There are many different ways to “tune” a laser beam and here are just a few examples.

You will recognize TEM00 as the tuning pattern for our CUTTING laser beam which is all we are interested in. This pattern of intensity distribution is very common in nature and is variously known as a Normal Distribution, a Bell Curve or for laser applications, a Gaussian Distribution which is a mathematically defined statistical function.

This is a graph of the intensity profile for an ideal laser beam conforming to the GAUSSIAN function. The horizontal base line is the beam diameter and the height of the graph is light intensity. The AREA under the graph in this instance represents POWER (watts) and the percentages shown on the left image are how the power is apportioned within the beam. Without getting mathematical the 1, 2 and 3 either sides of the centreline are fixed area properties of the Gaussian graph.
People think that WATTS defines the capability of a laser beam, but although it has an effect, it is INTENSITY that actually causes material damage (as discussed previously). I can illustrate the “interesting” features of the Gaussian function with the two diagrams above.. On the left diagram, say the beam diameter is 6mm with power (area) of 60 watts.
If I squeeze those 60 watts into the smaller right diagram’s 2mm diameter beam, the Gaussian function must use the same area (WATTS) and this increases the height ( the INTENSITY) by approximately 3 so that the area of both shapes is the same.
This is the simple method by which you amplify intensity when passing the beam through a lens. The beam diameter decreases as it approaches the focal point and the intensity reaches stratospheric values.
Let’s take a look at this Gaussian intensity profile in two different ways to make sure you understand the real and important ways that this beam can vary its characteristic. You have seen from the previous pictures that for CUTTING with a laser beam we need high INTENSITY.
We could match the high intensity of the 2mm beam by changing the 6mm beam to180watts (3 times the area). Yes, they both conform to the Gaussian function but when they meet with a lens the outcome for the two beams will be completely different. This difference is dealt with later.

In this image there is a fixed diameter beam and as the power is increased you can see the beam move from “blunt” to “sharp”. This is exactly what happens to a high voltage driven glass tube as the power increases from say 10% for the first intensity graph (on the left) to the final 100% power graph (on the right). This is an interesting observation and bear in mind that more intensity creates faster cutting, so it would seem the perfect situation is to use 100% power and then further amplify (intensify) it with a lens.
Compare this with an equivalent power RF laser beam which has no POWER control, it is always at 100% …..just the single 100% beam with a fixed intensity profile. Pseudo power control is achieved with high frequency Pulse Width Modulation, a method that exposes the material to 100% power (the single “sharp” beam) for a percentage of each frequency cycle.
Lets look at the Gaussian INTESITY distribution within a laser beam in a different way that will allow a clearer understanding of how the beam interacts with a lens when we let these two components of our machine meet later in this report.

Here we have use different colours to represent the different intensities within a laser beam. Diagram A shows the 6mm diameter 60 watt beam we used earlier. Image B shows the 60 watt distribution superimposed onto the 6mm diameter180 watt beam (3 times the intensity). These are mathematically defined shapes so the PROPORTIONS of the 180 watt graph are the same as the 60 watt graph.
However, it is the absolute intensity values that cause material damage so I have chosen two values to compare. 13 and 82 are the intensities for A and at 3 times the power and the same proportions, the 180 watt beam are 39 and 246.
I will keep reminding you that the RATE of material damage is determined by absolute intensity and not relative intensity. Thus, the difference in the two values chosen for A is 69 and 207 for B. Now look at C where the intensity difference is still 207 but the intensity lines are now much closer together so the CHANGE of intensity across the beam is much more dramatic. This squeezing or stretching of a beam into different diameters will have consequences upon meeting with a lens.
Diagram C illustrates squeezing the 6mm 60watts into a 2mm diameter beam. It creates the same max intensity as the 180 watt beam and those red rays have the same damage potential as the 180 watt beam. Wow!!! So why do I need a 180 watt tube when a 60 watt tube will do the same job? That’s an interesting question that I was not able to answer until recently when I personally discovered a property of lenses that I was unfamiliar with and will be described later.
Now Let’s See Some Gaussian Beams Damaging Material
Many years ago, my first CO2 laser encounter was an ancient 1.5kw metal cutting machine. In those early days it was a weekly task to adjust the MODE to TEM00 because the tube mirrors were externally adjustable and not very stable. It was necessary to fire the beam into a block of acrylic and adjust the mirrors to find the sharpest single point “footprint”. That knowledge has served me well because as I mentioned earlier, acrylic is my best friend.
It allows me to see the intensity profile of the beam by virtue of the damage it causes. As I keep stressing, the greater the light intensity the faster the resulting damage. Here are examples of mode burns from 3 of my machines. Of course, in these machines I have no control of the mode, that is a fixed property of the sealed tube.

These three different beams are perfect illustrations of the beam behaviour in the previous two pages.
The first black and white graph showed how the beam shape changes with power from “bunt to “sharp”. Well, if instead, you keep the power constant (as in the top row of 70watt burns) look how the damage shape progresses and more or less mimics the graph. The central intensity is obviously greater than the outer part of the 6mm beam and it is this central high intensity that vaporizing acrylic faster than at the beam edge.
Hence the conical damage profile. Progression of this damage and the way it changes shape with exposure time to a sharper and sharper point is evident in the top two sequences. Note how from the first to the last images, the mouth of the cone remains constant (the beam diameter). These are described by rainbow graphs A and B.
The last set of RF beam images illustrates two points I have already mentioned.
- Squeeze less watts into a smaller beam diameter and the intensity MUST rise. Here
we have just 30 watts contained in a 3mm beam. The central intensity has gone sky
high and it is able to pierce through the 25mm acrylic in 1/3 of the time taken by the
70watt beam. Here surely is the proof that I don’t need a 70watt beam? - Note how there is fixed conical shape as the exposure time increases. Unlike the glass tube beam, the mouth of the cone just increases its diameter as the exposure time increases.
This characteristic is described by rainbow graph C.
3. Let’s Examine the Properties of the Lenses We Use.
As I explained during the introduction and background, the lenses we use would work to specification if our machines were IMAGE transmitters such as telescopes, projectors or cameras. They are not. Instead, we wish to utilize lens technology to focus (enhance) the intensity properties of a laser beam so that we can do damage to materials.
We have just seen evidence of how the different INTENSITIES within the raw beam can inflict material damage without the use of a lens but not enough to be useful. Let’s assume the 6mm beam can be focused down to 0.3mm. That’s an AVERAGE intensity amplification of 400. If we apply the same logic to the 3mm beam focusing to 0.2mm, we get an average amplification of 225. So, perhaps by this analysis, the smaller beam is not that good after all? Hmmm. Sadly, it’s nowhere near that simple.
I spent over 2 years testing lenses and examining cut profiles in an attempt to see if there were patterns of damage that would lead me to understand how laser beams cut. I tried all sorts of weird things in my efforts to isolate the cutting secret. One of the strangest and puzzling was this

This 38.1 FL lens was happily cutting 6mm material until I removed the central 1mm. It still engraves perfectly but will no longer cut. It implied that there was something important happening at the lens axis that was vital for cutting. For months I was distracted by the idea that there must be something illogical happening at the lens axis that caused an almost parallel beam of intense light to leak though and project beyond the optical focal point.
I was imagining this spike to be a bit like a drill that created a distant focal point. One day it hit me that I did not need a focal point to create a thin damage spike of energy.
Look at the 1 second mode burn images for the 70watt glass tube raw beam. After a few seconds a point appears, not because the beam is focused but because there is a natural high intensity within the beam that creates this fast-moving sharp damage front.
This is further confirmed by the 2mm RF beam images. A smaller beam has increased central intensity that morphs to a point much faster. I felt stupid and elated in equal measure……. I had known about the cutting mechanism all along but did not recognize it.
I thus concluded that there was no magic in the cutting mechanism after all but that a focused beam is just a way to create a VERY small footprint of energy at the material surface that will then proportionately erode via a non-focused intensity “spike” at an alarming rate. And there it was, CUTTING.…………………….or was it?

I had known for many years that only the simple plano-convex and meniscus lens forms were commercially available for our small machines. The myth was that they should only be used the “right way” as per the diagrams above because the normal parallel light rays would then focus in the designed manner. Look carefully and you will see that the plano-convex lens does not have perfect focus.
It suffers from something called aberration. A feature we ignore and accept because it seems to do no harm. The second concave surface on the meniscus lens corrects this natural imperfection by about 95% and is considered the perfect lens for creating precision engraving.
Did I drill out this aberrating section of the lens when I vandalized that poor 38.1mm plano-convex lens? If so, how could aberration influence cutting?
Research into aberration quickly revealed this interesting pdf document (cited earlier) http://users.ntua.gr/eglytsis/OptEng/Aberrations_p.pdf. It has nothing to do with laser technology and all to do with normal light and reveals several interesting facts.
First: All spherical lens geometries are subject to spherical aberration. That applies to ALL our lenses regardless of cost or manufacturing perfection.
Second: The effect of aberration on the focal point can be far beyond the slight fuzziness of the typical image above.
With the aid of some diagrams from the Aberrations PDF, I was able to substitute variable intensity laser rays for the normal uniform light rays and methodically devised a focusing regime that looked to describe the missing pieces of my mini mode burn model. Let me step you through. The following diagrams are calculated from formula that are also in that PDF.

This short focus 30mm diameter lens has example rays passing through at different distances from the lens axis. Note the huge change of focal length (f) for various rays as they move away from the axis (h).
Note. This is a nominal 50mm focal length lens made from normal glass. Zinc selenide has a different refractive index and would produce slightly different results.

Here is why myth says to not flip the lens. The focus has gone way beyond fuzzy and by all accepted theory should be a cutting and engraving disaster.
So how can it be possible that the best cutting lens for my 70 watt glass tube laser is a 2,5” GaAs planoconvex flipped like this? See the earlier picture of it cutting through 26mm thick hardwood.

The paths of light rays through a lens will obey the laws of refraction regardless of the refractive index of the lens material or the wavelength of the light. Although the aberration document deals explicitly with normal UNIFORM intensity light passing through a glass lens, those basic lens properties are fixed for ANY sort of light. We now have to examine what happens when we pass a non-uniform intensity laser beam through that same lens.
Let’s build a model in stages. If I superimpose the realistic intensities onto the specific rays in the diagrams above, all the low intensity non-damaging rays are so far away from the beam axis that in both cases their minimal intensity contribution to a single focal point is of no importance.
- What I have shown here is a 30mm beam entering a 30mm lens. This is not typical for our machines because a specified 5mm beam will be closer to 10mm overall diameter and it will typically sit around the axis a 20mm lens.
- In both cases above, the beam will enter the lens with a Gaussian intensity distribution but note carefully what happens to those various insignificant intensities by the time they reach a nominal focal point…..somewhat chaotic in both diagrams.
Let’s change the first diagram to the next stage:
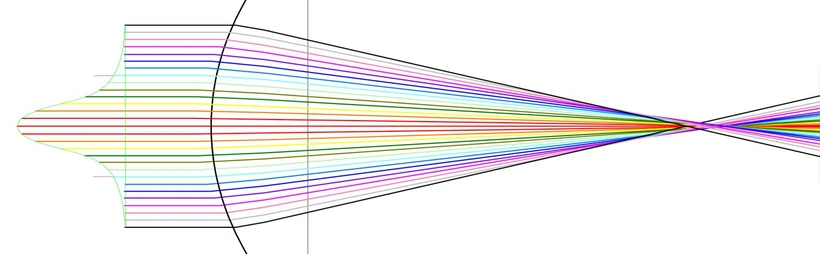
This is a 10mm beam fitting into a 20mm diameter lens. We have already established that the outer part of the beam is not contributing so to reduce confusion I will remove them.

Without the confusion of powerless rays we can see a stretched focal area appearing. Lets zoom in and look closer.

To the eye, it seems obvious that A is the focal point. Now you will understand the relevance of my pretty rainbow rays. After focus A, the weaker intensity blue green and yellow rays are DIVERGING. Whereas the most intense red and orange rays are still CONVERGING, increasing their intensity as they aim to a more distant focus. I am totally guessing when I point to position B as being what I call the INTENSITY FOCUS. This is a point where converging and diverging rays sum up to a maximum intensity “footprint” on the material surface. This point can only be determined by damaging material because it will change with power, speed and material (and lens type).
Point B is the kerf width because there are no rays to make it bigger. However, if we set the focus at the material surface (point B) we will now be carrying out a sort of mode burn but this time with a non-Gaussian intensity distribution.

If we look at all the beam intensities happening at footprint B, the most intense red and orange beams red dominate and have not yet focused. Let me remind you that when this beam is fired at the material, the SURFACE will experience a range of intensities just like a mode burn.
The combined intensities of the red and orange rays will produce a VERY small intense region at the centre of the beam footprint and will burn a small fast moving damage front (spike) before the outer part of the footprint gets a chance to develop as time passes.
Let’s see how these ideas compare to real material damage.

This is a 38mm FL lens beam characteristic test, where the first burn profile on the left is at the optical focal point. As the test progresses, the focal point is lifted in 1mm steps until at 5mm we reach the INTENSITY focal point mentioned above. In this example I have frozen the video action at a point where you can see the effect of that central high intensity as it burns a very small thin tube.
Remember that a normal raw beam mode burn has an intensity point not a focal point. So in this image what you see is an intensity point NOT the red beam focal point. That red beam intensity focal point is a physical position somewhere else in the material that we shall discover later.
We will now look at a 20 millisecond step-through of our rainbow beam to see if the damage BELOW the intensity focal point is in agreement with the ray diagram above.
You will note that I never use the term energy density because it is totally inadequate to describe what is happening here. Look at the previous rainbow ray diagram. Each one of those coloured rays has its own intensity and just because they fan out and the mathematical aggregated energy is lower, each ray will retain its own energy level (intensity) until it collides with a solid surface and that energy is converted to molecular vibration.
Russ Sadler
There are those who believe that these “pipes” are the result of total internal reflection (as in light pipes) but physics does not support this notion. Others suggest that there is low incidence angle reflection off the internal walls causing the “pipes”.
This may be imaginable for acrylic but why are all the pipes different shapes and how does either idea explain cutting tri-wall corrugated cardboard where the majority of the “wall” is fume filled air? I have an elegant test that illustrates that 10.6 micron light is not reflected off an almost zero angle surface. See https://youtu.be/Ay0xFzhvbyI.
The physical evidence is much more satisfied by the idea of light travelling in straight lines until it ceases to be light energy when it collides with a solid surface.

After the initial “spike”, you can see that as the burn progresses, the entry hole (footprint) remains constant i.e. all the intensity sufficient to evaporate acrylic is passing through that hole. Lower damage threshold materials such as card may detect the outer low intensity rays as scorching.
In 2 the intensity sharp point is still pushing forward, but now the yellow green and brown rays are also entering the tube created by the red and orange rays. These diverging rays have sufficient intensity to evaporate a small amount of material from the tube walls they encounter. Thus, we have the start of the ballooning effect.
By 4, I suspect that the orange rays have focused and are now diverging to continue the ballooning where the green brown and yellow rays can no longer reach. There is still the very sharp intensity point to the burn in 3 and 4.
However, by 5 there is a distinct change to that intensity point. I suspect that somewhere between 4 and 5 the red beam has focused and at 5 we are seeing the hint of a DIVERGING red beam. After 5, the rate of damage progression halves and the pipe becomes parallel. If we allowed more time, the direction of that pipe becomes unstable as the damage is no longer light controlled but just turbulent hot gas damage (as you have witnessed in the acrylic beam drag demonstration.)
These tests just demonstrate that the intensity ray idea is a credible mechanism to explain the physical damage we can witness. However, this is NOT cutting.
Cutting is never a fast process, so let’s assume 20mm/s for a thinnish material and that the kerf could be 0.15mm wide. How many 0.15mm holes side by side can I get into 1mm? Let’s say 6. However, they will be just perforations and not really a cut, so let’s make that 10 perforations to create an approx. cut 1mm long Cutting at 20mm/s means I need to pierce 200 holes per second (1 sec = 1000ms). So, each hole must complete in 1000/200 = 5ms.
This sets a typical duration of a cutting “spike“, say between 5 and 10ms (estimated). That is about the duration of the first “spike” we witnessed for the above test. The conclusion we reach is that it’s an incredibly small high intensity PART of the footprint responsible for cutting and explains why this lens experiment killed cutting stone dead…….there are no red rays being even slightly focused.
Let’s flip the lens and examine the differences.

Let’s again strip off all the near zero intensity rays beyond pale blue.

We see a fairly long focal range (at a distance) So let’s zoom in.

Let me remind you that the rate of evaporating acrylic at the entry footprint is totally dependent on the intensity profile at that PLANE. The colour allows me to track the various rays but not the actual intensity because that is a continually changing parameter for each colour zone as approaches its focus. Obviously, the red zone at the centre appears to be most intense, but perhaps the lower intensity yellow rays are the most intense at this plane because they are just about to reach focus.
As I said, this is a very complex set of conditions to visualize and I can only try to make an analogue “best guess” as to where the net intensity focus actually occurs. This will only be detectable when real
intensity profiles hit real material. In this case it looks like a much smaller more intense central intensity to the initial footprint that will cause an even smaller, faster and deeper initial “spike” of damage.
That hole then presents a SURFACE that any rays entering the hole entrance will collide with and give up their energy. Depending on the direction of those rays they will either promote forward hole growth or if they are diverging, they will hit the side walls and cause ballooning.

As just stated, the intensity focus will reveal itself by creating the smallest entry hole. The second line on the right marks the point where the diverging red beam matches my guestimate of the entry hole footprint. At this extreme point there is only a defocusing red zone to create damage. Just because the red rays reach a focus, that does not stop damage. Light energy transfer erosion will not cease until, the red beam has diverged to a point where the material damage threshold cannot be achieved and just heating occurs.

Here is how the beam propagated during 300ms exposure. It is important to note that these images are profiling the beam damage below the intensity focal point (the entry hole remains constant size) to see if the ray diagram predicts the reality of the damage we witness. They are NOT a measure of cutting efficiency at this stage but just a demonstration of the likely cutting mechanism.
As we estimated previously, cutting is a 5 to 10ms operation and there are separate test to evaluate how different lenses perform.
In 1 there is VERY high intensity at the centre of the footprint that has created a super thin burn more than 4mm deep.
By image 3 (60ms) the entry footprint has fully developed to is full diameter and the effects of the green and yellow diverging rays are starting to erode the tube into the beginning of ballooning. Then orange rays have taken over and continued the ballooning.
At image 8 there is a something interesting happening half way down the burn. I anticipate that this is where the red rays reached their focal point and then start diverging and it’s just the high intensity red rays creating a second phase of ballooning as they gradually diverge and lose their damage capability. I believe the final wandering point, that is not in line with the beam, is caused by hot gas erosion, not light energy.
The whole 300ms burn was far too long to examine under the microscope. I have broken it into 4 images so that we can examine the “tube” in detail and gain more circumstantial evidence of what probably happened within.

Here we see the entry hole that looks to be almost at the perfect INTENSITY focal point because there is just a hint of a conical entry.
Years of studying acrylic damage allows me to assess that this slightly uniform semi frosted finish is caused by simple clean evaporation Hence it seems that even the diverging yellow and green rays are intense enough to cause clean surface vaporization until the middle of the ballooning where they are losing their intensity and beginning to heat and liquify the walls. On the right you can begin to see evidence of the acrylic surface boiling (bubbles) as the wall temperature drops to its liquid phase.

In this second quarter of the tube, as the diverging intensities decrease the erosion (ballooning) decreases and there is more evidence of surface boiling that has frozen when the surface solidified below 160C. The opaque matt frosted surface is caused by the hot gas turbulence, micro rippling the surface of the liquid acrylic as it solidifies.
As the diverging effect of the yellow rays decreases the converging effect of the orange and red rays is just reaching their focal points at the right of this image.

The left of this image is about halfway through the burn at 10mm deep. The tube reduces to a thin neck where the surface is now almost clear. The neck seems to indicate this is the focal point of those most intense red rays which then start to diverge creating a secondary ballooning effect.

This “hairy” effect on the outside of the tube I believe to be micro stress cracks where there is a lot of hot vapour inside the tube but insufficient light energy to effect “in-line” erosion. This tail of damage often wanders off line by significant amounts and is always characterized by this hairy appearance.
As I have mentioned several times, this ray analysis has been to establish just what features of a laser beam and lens characteristic interact to produce cutting. I have already given an example of how cutting takes place within the first few milliseconds of beam penetration.
We have seen how lens aberration and non-uniform light intensity produces a central core of high intensity light that projects well beyond the nominal intensity focus point. It is this non-Gaussian intensity surface footprint that creates an aperture that filters the non-destructive intensities and allows only the most intense rays below the surface to propagate a cut.
We will now compare the cutting potential of different lenses tested in both orientations. Recall that my experience with the 26mm hardwood cut indicated that the “right” way for a lens seems to be the wrong way for efficient laser cutting.

This image compares two penetration tests back-to-back for easy comparison. The first penetration is 2ms duration and each subsequent test increases by 2ms up to 30ms max.
Please recall that the max estimated time to carry out a cut is 10ms.
These tests are for the same 38.1mm plano-convex lens used throughout these tests. The top pattern is for a lens used the “right” way (convex side up) and the bottom set are with flat side up (the wrong way). The background lines are 2mm increments.
Thus, with this lens the “wrong” way it reaches 4mm penetration in 8ms The “correct “way takes 18ms. This is a clear indication that the same beam passing through the same lens results in two significantly different cutting potentials.
We indicated earlier in this report that the other type of lens we could use is a meniscus lens where the concave lower face of the lens adds extra refraction to reduce the aberration effect by about 95% and attempts to produce a much better focus.
The diagrams and initial results we have seen so far, illustrate that lens aberration is an ESSENTIAL requirement for cutting and that removing it may harm cutting efficiency.

Here is a 38.1 meniscus lens performance for comparison. The top penetrations are with the lens convex side up (the correct way) and the bottom set with the convex face down (the wrong way) …….hideous aberration. The correct way for this lens makes it great for engraving. It never reaches 4mm and has a “chunky” penetration shape. When used the wrong way, this lens reaches 4mm in the same 8ms as above but with a much thinner “spike” of intensity.
I don’t think there can be any clearer evidence that aberration is good for cutting and the greater aberration using a meniscus lens the wrong way gives deeper cutting ability.
Let’s see how this comparison holds for other lenses. All done with the same beam and the same power. Convex side up is always the top pattern.

Again note how the “wrong “ way penetrates to 4mm in 8ms.


Wow. This is the most powerful lens in my collection. It is always used the wrong way because it cuts fast and deep and is my everyday lens.
However, this may not be true for all machines because as you have seen, if the INTENSITY distribution within the beam is different to mine, the same lens will produce a different outcome. IT IS THE BEAM AND LENS COMBINATION THAT PRODUCES A RESULT, NOT JUST ONE OF THEM.

Wow this is rubbish for cutting but great as an engraving lens.
Why the massive difference between this and a 63.5 ZnSe meniscus laser lens?
The refractive index of this material is different to ZnSe and this causes several differences. The major difference it the spherical geometry of the convex and concave faces is much flatter and the central high intensity part of the beam is passing through the least refractive (almost flat) part of the lens and hardly being focused.
Yes, it is still being refracted just as physics dictates, but the intense axial rays are being focused towards a large range of focal points way beyond the optical focal distance. The geometry of a 63.5 GaAs laser lens is flatter than a 101mm ZnSe laser lens so let’s take look at how the longer focal length performs.

Used the wrong way it is marginally less powerful than the 63.5 GaAs plano-convex lens. Note also, this is the only lens where orientation seems to make little difference.

This meniscus 101mm ZnSe lens is still not comparable to the GaAs 63.5mm plano-convex lens. This takes 10ms v 8ms for GaAs and to 6mm it’s 18ms v 12ms for GaAs.
Conclusions
I have presented evidence using the 38.1 mm lens as my vehicle because it demonstrates easiest in diagrammatic form, the principle of how aberration destroys the original beam Gaussian intensity to something unpredictable at the focal point.
In fact it demonstrates that the optical focal point can be different from the INTENSITY focal point and the high intensity central rays focus in an uncoordinated way over a range of distances far beyond either of these focal points. It is that spread out range of central high intensities that creates the lens’s ability to cut.
I inadvertently saw this effect without recognizing why, when I did this to a lens and destroyed its cutting capability.
squeeze a high intensity small diameter beam through various lenses and the results were very poor. The whole narrow beam ( see the RF mode burn for example) is so close to the flat, very low refracting lens axis that it become a gradually converging entity with a wide range of focal points for each intensity. Thus it does not have a recognizable focal point and will not cut.

Beam size is an important factor in how lenses perform. In other experiments have tried to squeeze a high intensity small diameter beam through various lenses and the results were very poor. The whole narrow beam ( see the RF mode burn for example) is so close to the flat, very low refracting lens axis that it become a gradually converging entity with a wide range of focal points for each intensity. Thus it does not have a recognizable focal point and will not cut.
For a fixed power, the opposite is true. A bigger diameter beam will have a wider less intense profile that will have completely different cutting characteristics after it passes through a lens. The reduced central intensity means aberration will be less effective. However, this effect can be countered by increasing the power which again changes the intensity profile that engages with the lens.
Lenses and laser beams are not as simple as the 2+2=4 that we have all believed and apply. In reality the equation is actually like this ……..?+?=?
When you understand the importance of ?+?=? you will see that lenses can never be created to suit laser beam intensities. If they created perfect focus for one intensity profile I’m sure that lens would be ineffective at cutting. Change the BEAM intensity profile and that lens will no longer be perfect…….if perfect is what we want. I think not. We may as well stick with the current lens designs and better understand that the relationship we all now use is approximate.
My final takeaway is :-
Spherical aberration is a vital natural property of lenses that allows laser beams to cut.
Frequently Asked Questions
What is a laser lens?

A laser lens is an optical lens used in the laser industry and is typically used to focus a parallel laser beam down to a small point to improve laser cutting performance and reduce the kerf width. For CO2 lasers, lenses are typically made from Zinc Selenide (ZnSe) or Gallium arsenide (GaAs). The focal length of CO2 laser lenses range from 1″ to 5″.
How does a laser lens work?

A laser lens works by refracting the parallel beams of light in a laser beam and focussing them to a point at a specified focal distance. This focussing concentrates the laser beam power into a small spot, greatly increasing its cutting power.
In reality, aberrations in the lens results in there being a number of different focal positions depending on the position the laser beam hits the lens surface. This results in lenses having a focal zone of 2~5mm in length
Which lens for CO2 laser?

There are a number of different types of laser lens for a CO2 laser.
First, there is the material the lens is made from, which are typically Zinc Selenide (ZnSe) or Gallium arsenide (GaAs). ZnSe lenses are also split into two variants depending on how the coating is applied.
Physical Vapour Deposition (PVD) is the cheaper variant and is good for laser power up to 80 watts.
Chemical Vapour Deposition (CVD) is a higher quality product and is good for laser power up to 300 watts.
Secondly there is the shape of the lens, most common is the plano-convex lens (flat one side and convex on the other), followed by the Meniscus lens (convex on one side and concave on the other).
How long should a laser lens last?

If you take care of your laser lenses and ensure there is always a positive air pressure at the lens surface to keep smoke and dust particles away from the lens, then your lenses can last years. Lenses deteriorate when dust particles melt onto the surface of the lens and cause hot spots. This localised heat can cause failure of the coating or in extreme cases, cracking of the lens.
What Next?
Did you enjoy this post? Why not check out some of our other posts:
Disclaimer
Last updated April 25, 2024
WEBSITE DISCLAIMER
The information provided by n-Deavor Limited, trading as Laseruser.com (“we,” “us” , or “our”) on (the “Site”) is for general informational purposes only. All information on the Site is provided in good faith, however we make no representation or warranty of any kind, express or implied, regarding the accuracy, adequacy, validity, reliability, availability or completeness of any information on the Site.
UNDER NO CIRCUMSTANCE SHALL WE HAVE ANY LIABILITY TO YOU FOR ANY LOSS OR DAMAGE OF ANY KIND INCURRED AS A RESULT OF THE USE OF THE SITE OR RELIANCE ON ANY INFORMATION PROVIDED ON THE SITE. YOUR USE OF THE SITE AND YOUR RELIANCE ON ANY INFORMATION ON THE SITE IS SOLELY AT YOUR OWN RISK.
EXTERNAL LINKS DISCLAIMER
The Site may contain (or you may be sent through the Site) links to other websites or content belonging to or originating from third parties or links to websites and features in banners or other advertising. Such external links are not investigated, monitored, or checked for accuracy, adequacy, validity, reliability, availability or completeness by us.
WE DO NOT WARRANT, ENDORSE, GUARANTEE, OR ASSUME RESPONSIBILITY FOR THE ACCURACY OR RELIABILITY OF ANY INFORMATION OFFERED BY THIRD-PARTY WEBSITES LINKED THROUGH THE SITE OR ANY WEBSITE OR FEATURE LINKED IN ANY BANNER OR OTHER ADVERTISING.
WE WILL NOT BE A PARTY TO OR IN ANY WAY BE RESPONSIBLE FOR MONITORING ANY TRANSACTION BETWEEN YOU AND THIRD-PARTY PROVIDERS OF PRODUCTS OR SERVICES.
AFFILIATES DISCLAIMER
The Site may contain links to affiliate websites, and we receive an affiliate commission for any purchases made by you on the affiliate website using such links. Our affiliates include the following:
- makeCNC who provide Downloadable Patterns, Software, Hardware and other content for Laser Cutters, CNC Routers, Plasma, WaterJets, CNC Milling Machines, and other Robotic Tools. They also provide Pattern Files in PDF format for Scroll Saw Users. They are known for their Friendly and Efficient Customer Service and have a comprehensive back catalogue as well as continually providing New Patterns and Content.
- Cloudray Laser: a world-leading laser parts and solutions provider, has established a whole series of laser product lines, range from CO2 engraving & cutting machine parts, fiber cutting machine parts and laser marking machine parts.

